Is Gary Antonacci's Global Equity Momentum Strategy Robust?
Gary Antonacci’s excellent book Dual Momentum Investing is a cult hit. Its success is easy to understand. It offers a simple trading system that crushes the market in both absolute and risk-adjusted terms. Antonacci calls it Global Equity Momentum, or GEM.
Here’s how it works: At the end of each month, compare the trailing 12-month total returns of U.S. and foreign stock markets. Select the one with the higher return. If the selected asset’s 12-month total return is higher than the 12-month total return of cash, buy it. Otherwise, buy investment-grade bonds.
The strategy combines a relative momentum signal (what’s doing better?) with an absolute momentum signal (is it positive?) in a simple and intuitive manner.
Antonacci uses the S&P 500, MSCI ACWI ex-US, and Barclays US Aggregate Bond total return indexes to represent U.S. stock, international stock, and investment-grade bond returns, respectively. Here are his back-test results using different lookback windows, including trailing 9, 6, and 3 months.
| GEM, 12/1973-12/2013 | |||||||
|---|---|---|---|---|---|---|---|
| GEM12 | GEM9 | GEM6 | GEM3 | ACWI | |||
| Annual Return % | 17.43 | 15.85 | 14.37 | 13.9 | 8.85 | ||
| Standard Deviation % | 12.64 | 12.39 | 11.84 | 12.04 | 15.56 | ||
| Sharpe Ratio | 0.87 | 0.78 | 0.71 | 0.65 | 0.22 | ||
| Max Drawdown % | -22.72 | -18.98 | -23.51 | -23.26 | -60.21 | ||
| Source: Antonacci, Dual Momentum Investing | |||||||
GEM almost doubles the annual return of the world stock index. The comparison understates GEM’s advantage. The strategy achieved higher returns with lower volatility and shallower drawdowns. What volatility GEM experienced tended to be on the upside. Moreover, the strategy was uncanny in its consistency, outperforming in almost all periods, even doing better in the past two decades. The exhibit below plots the wealth ratio of the GEM versus a 35-35-30 U.S.-international-bond asset allocation (the results are slightly worse against a 50-50 U.S.-international stock allocation).

When faced with extraordinary back-tested results, we must be extraordinarily skeptical. Good scientists look hard for disconfirming evidence, reasons to knock down a claim, not bolster it. Can we replicate the results? Do they significantly change when we use different indexes? Look at different periods?
I successfully replicated Antonacci’s tests. For good measure, I tried some wacky variations, including lagged windows. GEM1-12, for example, ignores the previous month and uses the 12 months prior to that as its lookback window. Even with six-month returns that are six months stale (GEM6-6), the strategy works.
| GEM Replication, 12/1973-12/2013 | ||||||||||||
|---|---|---|---|---|---|---|---|---|---|---|---|---|
| GEM12 | GEM9 | GEM6 | GEM3 | GEM1-12 | GEM3-9 | GEM6-6 | ||||||
| Annual Return % | 16.70 | 15.83 | 15.49 | 14.57 | 16.07 | 15.23 | 14.95 | |||||
| Standard Deviation % | 12.80 | 12.73 | 12.53 | 12.74 | 12.88 | 13.17 | 13.29 | |||||
| Sharpe Ratio | 0.87 | 0.81 | 0.80 | 0.71 | 0.82 | 0.74 | 0.71 | |||||
| Max Drawdown % | -19.07 | -25.44 | -22.40 | -23.26 | -19.19 | -26.85 | -26.56 | |||||
| Risk-free Rate: 5.52% Sources: MSCI, Morningstar, author's calculations | ||||||||||||
My results are slightly worse than Antonacci’s. I never found the return broke 17% annualized. However, I used the Barclays US Aggregate Treasury Bond Index rather than the Barclays US Aggregate Bond Index. I was careful to match his methodology otherwise, splicing the MSCI World ex-US Index with the MSCI ACWI ex-US Index in 1988, using 90-day T-bill returns, and so on.
Note that the 12-month window also happens to be the best-performing strategy. While there is a good economic argument to be made for momentum, there’s no good argument that says momentum should work best over 12-month periods. Why not 10 months? Or even 9? If 9-month momentum worked best, we'd be hearing about that, not 12-month momentum. There is some data-mining here (as there are in all back-tests--you wouldn't be reading this if the back-test didn't work).
Is Stock-Bond Timing Robust?
I was intrigued by the efficacy of the stock-bond switching strategy, which Antonacci calls absolute momentum. Almost all of Antonacci's tests begin in 1974, but there is reasonably good U.S. stock and bond return data going back to 1926. How does Antonacci's absolute momentum rule work prior to 1974? (Relative momentum has been beaten to death and is well-established, so I won't be testing it here.)
I obtained monthly market and 30-day T-bill returns from the French Data Library. I have, courtesy of my former employer, monthly returns for the Ibbotson US Intermediate Term Government Bond Index. The common start date for these return series is June-end 1926. With these data, I tested the absolute momentum stock-bond switching strategy from June-end 1927 to May-end 2015. Each month, the strategy compares the trailing total return of the stock market to the trailing total return of cash. If the stock market’s return is higher, hold stocks. Otherwise, hold bonds.
I tested permutations of the strategy, with 3-, 6-, 9-, and 12-month lookback windows. I also tested lagged lookback windows. Here are my results.
| US Stock-Bond Timing, 06/1927-05/2015 | ||||||||
|---|---|---|---|---|---|---|---|---|
| Timing12 | Timing9 | Timing6 | Timing3 | Timing1-12 | Timing3-9 | Timing6-6 | 70-30 | |
| Excess Return % | 7.98 | 7.88 | 6.57 | 6.14 | 6.06 | 6.44 | 7.36 | 5.23 |
| Standard Deviation % | 12.81 | 13.29 | 12.64 | 13.42 | 13.01 | 13.08 | 13.66 | 13.30 |
| Sharpe Ratio | 0.62 | 0.59 | 0.52 | 0.46 | 0.47 | 0.49 | 0.54 | 0.39 |
| Maximum Drawdown % | -41.76 | -44.59 | -54.30 | -61.13 | -34.11 | -41.16 | -34.81 | -71.11 |
| Sources: French Data Library, Morningstar, author's calculations | ||||||||
A couple of notes on my presentation. I show excess returns rather than nominal returns. Excess return is calculated by subtracting the cash return (in this case, 30-day Treasury bill returns) from total return. A 10% return is unimpressive if cash yields 13%, but is phenomenal if cash yields 0%. Excess returns are comparable across different interest-rate regimes whereas total returns are not. My drawdowns are also computed in terms of excess returns. A strategy that earns 0% while cash yields 10% has incurred a 10% opportunity cost; it's only fair to penalize the strategy.
OK, back to the table. Every variation beat the stock market and the blended 70-30 stock-bond portfolio in risk-adjusted terms. However, tweaking the lookback window strongly affected results. If you lag the 12-month lookback window by a month, the excess return deteriorates to 6% from almost 8%. Bizarrely, if you lag the 6-month window by 6 months, your returns are almost as good as the 12-month unlagged signal.
The results are heavily influenced by returns from the 1930s and 1940s. I looked at the results from 1960 on. The strategy still beats the 70-30 benchmark on a risk-adjusted basis, with the exception of the 1-12 variation. Maximum drawdowns are lower across the board.
| US Stock-Bond Timing, 12/1959-05/2015 | ||||||||
|---|---|---|---|---|---|---|---|---|
| Timing12 | Timing9 | Timing6 | Timing3 | Timing1-12 | Timing3-9 | Timing6-6 | 70-30 | |
| Excess Return % | 6.64 | 6.28 | 5.96 | 6.13 | 4.82 | 4.88 | 5.28 | 4.35 |
| Standard Deviation % | 11.66 | 11.22 | 11.17 | 10.95 | 11.94 | 11.70 | 11.81 | 11.00 |
| Sharpe Ratio | 0.57 | 0.56 | 0.53 | 0.56 | 0.40 | 0.42 | 0.45 | 0.40 |
| Maximum Drawdown % | -25.23 | -26.45 | -27.89 | -27.70 | -31.04 | -31.04 | -31.04 | -42.96 |
| Sources: French Data Library, Morningstar, author's calculations | ||||||||
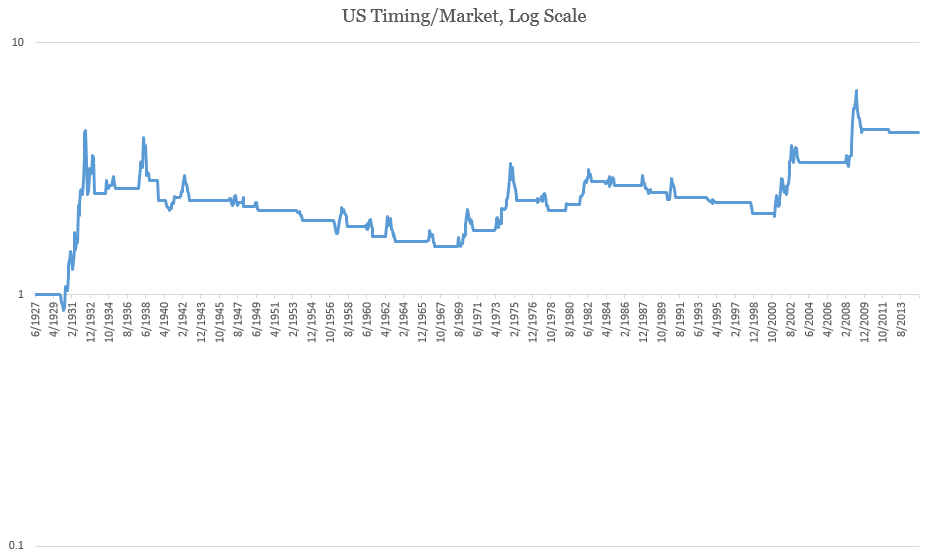
What’s the catch? When the stock market is in a secular bull phase, timing strategies can lag—a lot. Below is a wealth ratio chart of the 12-month stock-bond timing strategy against the market. While the strategy protected against declines in all five major bear markets, it could lag for decades. I don't think many investors understand how extreme the tracking error can get.
However, it is unfair to compare a strategy that is far less exposed to market risk with the stock market. A fairer benchmark is a blend of the average exposures of the timing strategy (though we can't know it ex-ante). On average, the timing strategy was in the market 70% of the time and in bonds 30% of the time. Below is the wealth ratio of the strategy against the 70-30 stock-bond benchmark. The performance looks better, but you can still go decades treading water. After taxes and trading costs, your returns would've been much worse.

Again, keep in mind the 12-month timing strategy is the best-performing of all the permutations I’ve tested. That 1) tweaking the lookback window universally hurts the results and 2) the few extreme episodes that drive all the returns means we should apply a discount to our expectations of the strategy going forward.
Summary
To answer the initial question: Yes, Antonacci's GEM is robust to changing specifications. Risk-adjusted returns are universally better across a wide range of parameters. Even when we extend stock-bond timing back to 1926, the strategy works. However, returns tend to degenerate—sometimes significantly—when we move away from a 12-month lookback window.
I ignored costs. However, the strategy still would've worked over the past twenty years (better, in fact), when trading costs were cheap. That the market does not seem to have arbitraged away these profits should be disturbing. Either the market is disgustingly inefficient, allowing this kind of simple price-based strategy to work (it violates the weak-form efficient market hypothesis) or we are chasing a will-o'-the-wisp created by data-mining.
A more important question: Would I put my own money into this strategy? Yes. In fact, I have been applying a trading system very similar to GEM with over a third of my personal assets since 2011. My live performance has been in line with the back-tests, bolstering my confidence in the strategy. There is no substitute for out-of-sample, live, real-money performance.